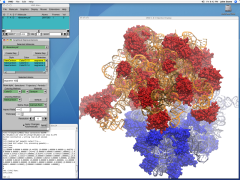
VMD is designed for the visualization and analysis of biological systems such as proteins, nucleic acids, lipid bilayer assemblies, etc. It may be used to view more general molecules, as VMD can read standard Protein Data Bank (PDB) files and display the contained structure. VMD provides a wide variety of methods for rendering and coloring a molecule: simple points and lines, CPK spheres and cylinders, licorice bonds, backbone tubes and ribbons, cartoon drawings, and others. VMD can be used to animate and analyze the trajectory of a molecular dynamics (MD) simulation. In particular, VMD can act as a graphical front end for an external MD program by displaying and animating a molecule undergoing simulation on a remote computer.
Key features of VMD include:
- Support for all major computer platforms
- Many excellent VMD tutorials developed locally, and by the research community at large
- No limits on the number of molecules, atoms, residues or number of trajectory frames, except available memory
- Many molecular rendering and coloring methods
- Stereo display capability
- Extensive atom selection syntax for choosing subsets of atoms for display (includes boolean operators, regular expressions, and more)
- Support for over 60 molecular file formats and data types through an extensive library of built-in file reader/writer plugins and translators
- VMD includes a multiple sequence alignment plugin, a unified bioinformatics analysis environment that allows one to organize, display, and analyze both sequence and structure data for proteins and nucleic acids.
- Ability to export displayed graphics to files which may be processed by a number of popular ray tracing and image rendering packages, including POV-Ray, Rayshade, Raster3D, and Tachyon
Website : http://www.ks.uiuc.edu/Research/vmd/

 SweetMollyGrace is a suite of freeware tools for automating work of rendering and animating molecules. Imports molecules in PDB, MOL XYZ format (Babel) Generates high quality images of molecules using raytracing tools (Povray and Raster3D). Makes 4 kinds of animation (only rotation around axes) using frames generated by Povray, Raster3D, Rasmol and Qmol. Saves animation in AVI, MPEG, GIF, MOV and FLIC. Generates and views 3D files (without texture) in the following formats: VRML (WRL) Autocad (DXF), 3DStudio (3DS) Wavefront (OBJ) Lightwave (LWO) DirectX (X) and RAW. Imports and manages POV and VRML files generated by Accelrys "ViewerLite 5.0" (not included download). Makes and views Postscript (PS) images.


